As someone who has been in public school system for 12 years, I’ve always wondered how different factors that vary from school to school can affect students’ future.
To quell my curiosity, I decided to look at public school data from Massachusetts. The Massachusetts Department of Education releases annual statewide reports in regards to assessment and accountability, finance, and student performance. The following analysis is done with their 2017 dataset found here.
The overarching question is: What factors affect a student’s success?
To help answer this question, I formulated additional guiding questions:
- What factors affect students’ SAT Score?
- Does higher SAT score lead to higher levels of college attendance?
3. How do the different accountability levels of the school and SAT scores affect students’ college attendance percentage for different types of colleges?
4. Which schools have better performance, charter schools or public Schools
Question 1: What factors affect students’ SAT Score?
The dataset provides data for almost 2000 elementary, middle, and high school in Massachusetts. Since only high schoolers take the SATs, I only looked at schools that served grades 9–12th.
Each school provided the average SAT score for each section: Reading, Writing, Math. For those unfamiliar with American standardized testing, the SAT is a common college admissions assessment taken nationwide and is composed of the three sections mentioned above. The maximum score for each section is 800, with the maximum total score being 1600 (writing is optional and is not factored in).
I first did a box plot of the different SAT scores. Since there doesn’t seem to be much variation between the 3 scores, I chose to use Average SAT_Reading for all subsequent analysis.

Using Average SAT_Reading scores, I plotted it against various attributes to see any potential correlations.

Using the average class size within each school, there seems to be a slight positive correlation between 10–20 on the x-axis.

There seems to be a larger cluster of data in where there are 0–50 students who’s first language is not English. There is a weak negative trend afterwards, but with very few data points.

There doesn’t seem to be a clear correlation between the average money a school spends on a student and their SAT score

The average salary of a teacher has a moderate positive correlation with SAT score. However, we cannot imply a causation because there are other factors that can influence student performance
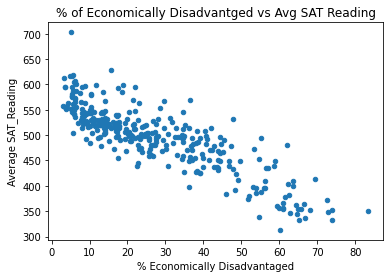
A strong negative correlation is seen in this graph. Schools with a higher proportion of their students that are economically disadvantaged exhibit lower SAT scores.
In conclusion, average teacher salary and the percentage of economically disadvantaged students are two attributes that have a stronger correlation to a student’s SAT reading score. Thus, we will be using economic disadvantaged for further analysis
Q2: Does higher SAT score lead to higher college attendance percentage?

There is a positive correlation observed between average SAT reading score and the percentage of students that attend college
Q3: How do the different accountability levels of the school and SAT scores affect students’ college attendance percentage for different types of colleges?
Accountability Levels
The Massachusetts public school system classifies their schools in a five-level scale, also known as the Accountability and Assistance Level. Higher performing schools are in Level 1 and the lower performing schools are in Level 5.
As shown in the above graph, schools with a higher percentage of economic disadvantaged students do not perform as well. Using a box plot, it can be seen that the accountability levels correlate with “% of Economic Disadvantaged.”

Level 1 schools have the least economically disadvantaged students and Level 5 has the most. Because the Accountability and Assistance level is categorical data, we will use that for subsequent graphs instead of “% of Economically Disadvantaged.”
College Attendance Percentage Across Different College Types
For high school seniors that elect to go to college after graduation, the 4 main types of colleges they choose to go to are community colleges, private two-years, public two years, public four years, and private four-years.
I wanted to look at how a students SAT performance and the school’s accountability level relates to attendance percentages for these different college types.

First looking at private two-year college attendance, there are a lot of 0 values, meaning not many students choose to attend this type of college. For those that do, there is a negative correlation between SAT scores and attendance rate, meaning higher performing students don’t often attend private two-years.

Next, looking at community college attendance, a negative correlation is observed. Students with lower SAT scores choose to attend Massachusetts community college. Students with higher SAT scores opt for other college choices. The large clusters of students with higher SAT scores are also from Level 1 schools.

Public two-year college outcome also has a negative correlation, similar to that of community college.

In this graph, we can see that as student’s SAT scores increase, so does their public four-year college attendance rate. This positive correlation shows that public four-years are more competitive than public two-year colleges.

This graph exemplifies a strong positive correlation. Similar to public four-year colleges above, as student’s SAT scores increase, so does their private four year college attendance rate. Level 1 schools have higher attendance percentage, which makes sense because private colleges tend to be more expensive and families with a higher socioeconomic background most likely choose to attend higher performing high schools.
Since private two-years, community colleges, and public two-years demonstrate a negative correlation between average SAT scores and college attendance rate, we can conclude that higher performing students elect to attend more competitive colleges like public or private four-year colleges. Level 1 schools also tend to send more students to public and private colleges and as the level number increases, so does the attendance rate.
Q4: Do charter schools perform better than public schools?
I also wanted to further examine student performance in charter schools compared with public schools as there are differing opinions online in regards to which is the better option.
When examining charter versus public high schools, public schools tend to have a slightly higher graduation rate and SAT reading score. When it comes to college attendance however, charter schools have a higher rate.

When examining the percentage of students that are economically disadvantaged and the school’s accountability percentile, I choose to examine all schools including elementary, middle, and high. Charter schools, while having a higher proportion of students that are economically disadvantaged, also have a higher accountability percentile.

Conclusion
In conclusion, there are many factors ranging from family status to the school’s expenditure have a correlation to a student’s success, therefore we cannot simply imply a causation because of the large number of confounding variables. Just based on the initial analysis done with this dataset, the only factor that can be changed by the school to potentially improve student performance is average teacher salary because a small positive correlation between those two variables is observed.
In regards to college attendance, schools that have a higher average SAT scores have a higher college attendance rate. Colleges that are less competitive (community and two year colleges) have more students that attend with a lower SAT score, and colleges that are more competitive (four year colleges) have students with higher performance attending.
The charter school vs the public school analysis result is mixed. This may be because each charter school runs differently — some may be very selective in their pool of students, some may not, hence leading to different student performance outcomes.


